
Dashboard
Overview
The Dashboard gives you a real-time overview of your sales team's performance and lead activity for the current day and month.
What You'll See on the Dashboard
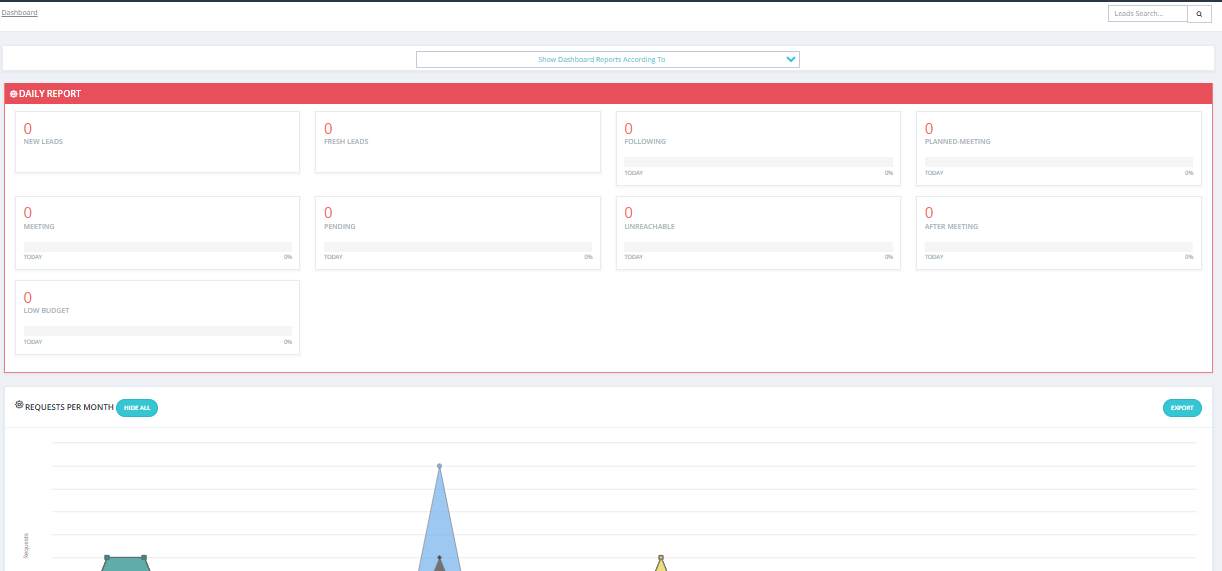
Daily Report
Shows a summary of leads and their states for today. It displays how many leads are in each state and which ones require an action today.
- If you are a manager/parent, you can see leads for all users under you in the hierarchy tree.
- If you are a regular user, you will only see your own leads.
💡 Only States that have a Next Action Date set will appear highlighted. States without a next action date will not show up in the daily view.
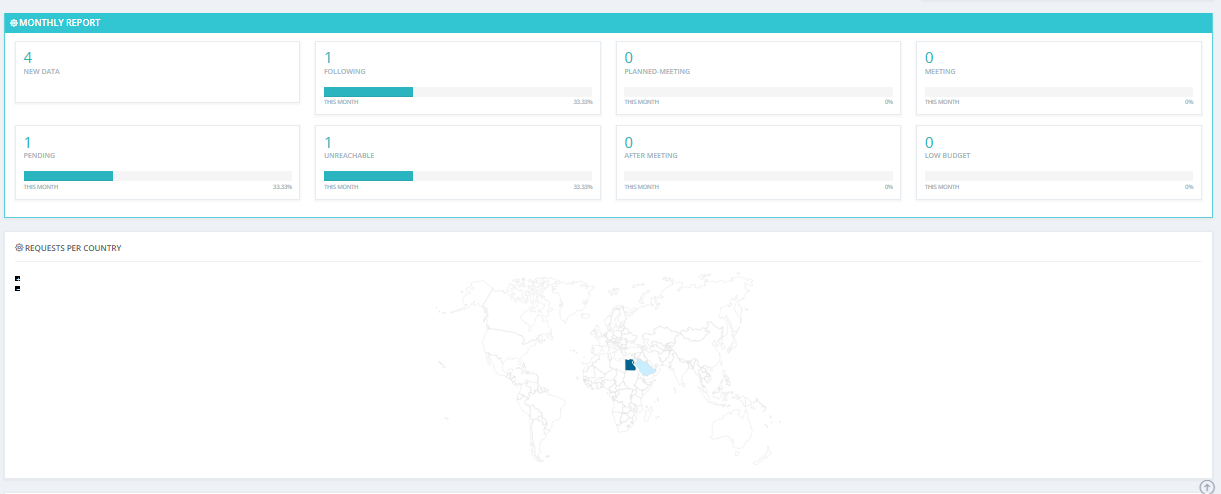
Monthly Report
Same as the daily report but calculated from day 1 to day 30 of the current month.
- If you are a manager/parent, you can see leads for all users under you in the hierarchy tree.
- If you are a regular user, you will only see your own leads.
Request Per Country
Shows where your leads are coming from geographically — for example, Egypt, Kuwait, and so on.
Delayed Leads Section
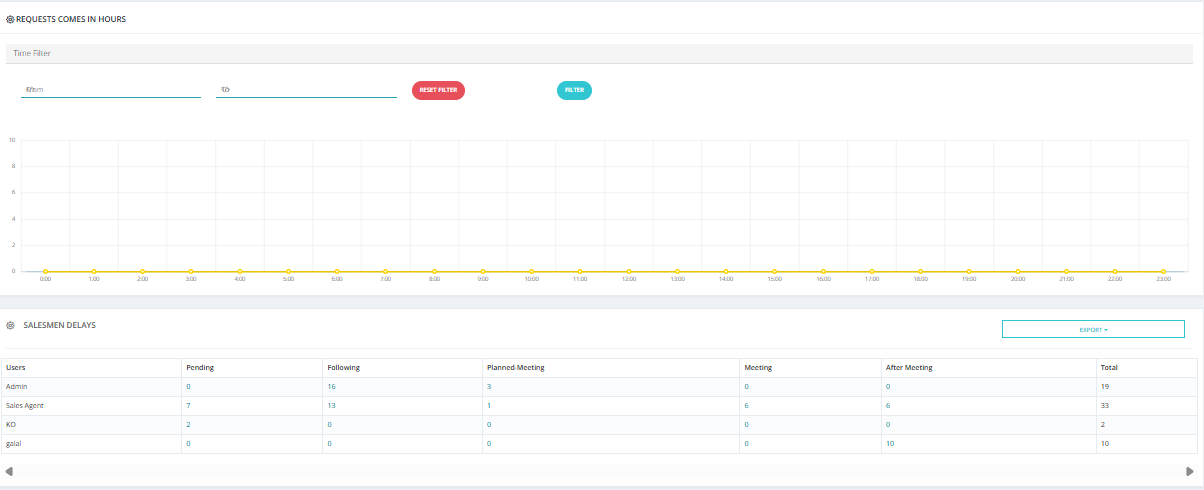
Displayed at the bottom of the dashboard. Shows which salesmen have delayed leads — leads that are overdue for action.
- If you are a manager/parent, you can see delays for all users under you in the hierarchy tree.
- If you are a regular user, you will only see your own delays.
You can click on any state in the dashboard to be taken directly to that filtered view automatically.
Key Things to Know
- The dashboard is read-only — you cannot take actions directly from here.
- Use it as a daily check-in to spot overdue leads and team performance at a glance.
- Clicking on a state card will redirect you to My Leads with an automatic filter applied.